Isophonic Curves and Equal-Loudness Contours: Understanding Human Loudness Perception Across Frequencies
Introduction to Isophonic Curves and Equal-Loudness Contours
Sound perception is a multifaceted phenomenon that extends beyond the mere physics of sound waves, encompassing the intricate ways the human auditory system interprets different frequencies and intensities. Central to this understanding are Isophonic Curves, also widely known as Equal-Loudness Contours. These curves map the sound pressure levels (SPL) necessary for sounds at various frequencies to be perceived as equally loud by the average human ear.
These contours are crucial for audio professionals, acoustic engineers, and researchers to predict how we perceive loudness differently across the frequency spectrum. This article explores the science, history, mathematical modeling, and practical applications of isophonic curves in audio engineering and psychoacoustics.
What Are Isophonic Curves (Equal-Loudness Contours)?
Isophonic Curves represent a set of lines plotted on a graph where each line indicates points of equal perceived loudness across different frequencies. Measured in phons, these curves translate subjective loudness sensations into sound pressure levels expressed in decibels (dB SPL).
The core idea is that our ears do not respond equally to all frequencies at the same physical intensity. For example, a 1 kHz tone at 40 dB SPL might sound louder than a 40 dB SPL tone at 100 Hz. The isophonic curves quantify these variations, showing that the human ear is most sensitive to mid-range frequencies—typically between 2 kHz and 5 kHz—and less sensitive to very low or very high frequencies.
Historical Development of Equal-Loudness Contours
The foundation of isophonic curves dates back to the 1930s when researchers Harvey Fletcher and Wilden A. Munson at Bell Laboratories conducted pioneering experiments on auditory perception. Their work led to the original Fletcher-Munson curves, which revealed how loudness perception changes with frequency and intensity.
Later, these curves were refined by researchers such as Robinson and Dadson (1956), whose data contributed to the modern understanding. Today, the ISO 226:2003 standard provides the internationally accepted set of equal-loudness contours based on extensive experimental data from multiple countries, improving consistency and reliability.
Mathematical Modeling of Isophonic Curves
The ISO 226:2003 standard mathematically defines equal-loudness contours using empirical functions that relate frequency and loudness level. The general form can be expressed as:

where:
Lp (f,Ln) is the sound pressure level in dB SPL for frequency f and loudness curve Ln in phons.
A (f) and B (f) are empirical functions that depend on frequency and have been experimentally defined.
Ln is the loudness level in phons.
Interpreting Equal-Loudness Contours
Key characteristics of isophonic curves include:
-
At 1 kHz, the phon value equals the SPL in decibels (e.g., 60 phons correspond to 60 dB SPL at 1 kHz), serving as the reference point.
-
At low frequencies (below approximately 100 Hz), the human ear requires significantly higher SPLs to perceive equal loudness, reflecting reduced sensitivity.
-
At high frequencies (above 10 kHz), there is also a noticeable decrease in sensitivity, though less pronounced than in the low-frequency range.
-
Mid-frequency sounds (roughly 2-5 kHz) are perceived as louder at lower SPLs due to the ear’s natural resonance and sensitivity.
These insights allow professionals to understand that loudness is not a linear function of SPL across frequencies and that equal physical loudness does not translate to equal perceived loudness.
Practical Applications of Isophonic Curves in Audio and Acoustics
Understanding Isophonic Curves and Equal-Loudness Contours has several critical applications:
1. Audio System Design and Sound Reinforcement
Sound engineers use these curves to tailor speaker frequency responses, ensuring consistent perceived loudness across the audible spectrum. This leads to clearer, more natural sound reproduction, especially in live sound environments and public address systems.
2. Audio Mastering and Mixing
Equal-loudness contours inform equalization (EQ) decisions during mixing and mastering, helping maintain a balanced sound that translates well across different listening volumes and environments.
3. Hearing Protection and Noise Regulation
Noise exposure limits rely on understanding how humans perceive loudness to establish safety standards that protect against hearing damage. Equal-loudness contours help quantify the real impact of noise beyond mere SPL measurements.
4. Psychoacoustic Research
These curves provide a foundation for studying auditory perception, hearing impairments, and designing hearing aids and audio devices that match human sensitivity.
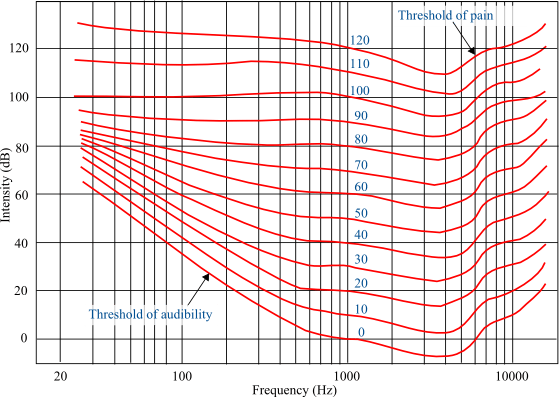
Visualization of Isophonic Curves
Graphs of equal-loudness contours typically show multiple curves, each corresponding to a specific phon level, plotted against frequency (Hz) on the x-axis and SPL (dB) on the y-axis. Such visualizations reveal the ear’s varying sensitivity across frequencies and loudness levels, offering invaluable guidance for audio professionals and researchers.
Conclusion: The Importance of Equal-Loudness Contours in Sound Perception
Isophonic Curves or Equal-Loudness Contours are fundamental tools that bridge the gap between objective sound measurements and subjective human hearing experience. By accurately mapping perceived loudness across frequencies, these curves enable optimized sound design, improved acoustic environments, and better auditory health practices.
Whether you are an audio engineer, acoustician, or researcher, mastering the concept and application of equal-loudness contours is essential to creating sound experiences that truly align with how humans hear.
Featured Articles
Tecnare
Loudspeakers Series
E Series
IBZA Series
V Series
ALIS Series
Array Series
SW Series
KT Series
TANIT Series
CS Series
Amplifiers Series
Digital Processors
Accessories